
Previous Installments
This post builds on information in Demystifying Git – Git Commits
What is git history?
Git history is the record of what has happened in your git repository.
As we learned in Demystifying Git – Git Commits, each commit object stores information about who, what, and when for that commit object AND the commit ID(s) of any parent commits. Git history, therefore, is the who, what, and when for each commit AND the relationships between each commit and the prior commit(s).
Because we already covered the who, what, and when information in Demystifying Git – Git Commits, here we’ll dive into the relationships between each commit and the prior commit(s).
Mathematical Concepts & Data Structures
Directed Acyclic Graph
Git history is a directed, acyclic graph (DAG) where each commit is a vertex and the relationship from a commit to its parent commit(s) form the edges.
The relationship between two directly connected git commits is inherently directed because one commit is the parent commit and one commit is the child commit — We can’t flip that relationship and come out with the same history graph.
Additionally, our git history graph is acyclic — Because the list of parent commit ID(s) is included in the information that git hashes to create each commit ID, a commit can not be its own ancestor. Its commit ID does not exist yet and so can not have been stored as a parent commit already.
Similarity to Linked Lists
Because commits may have multiple parents, git history is not really a linked list. If visualizing git history as a graph makes sense to you, ignore this section — git history is a graph, so you’re good go go!
If, however, you’re a bit confused by graphs but linked lists make sense to you, you can use your knowledge of linked lists to think about git history. Taking the list of parent commit ID(s) as link(s) to previous nodes, traversing git history is conceptually similar to traversing one or more linked lists. A commit with a single parent commit links to a single linked list. A commit with multiple parent commits links to multiple linked lists instead of just one.
Viewing git history
Viewing commit lists or changes only
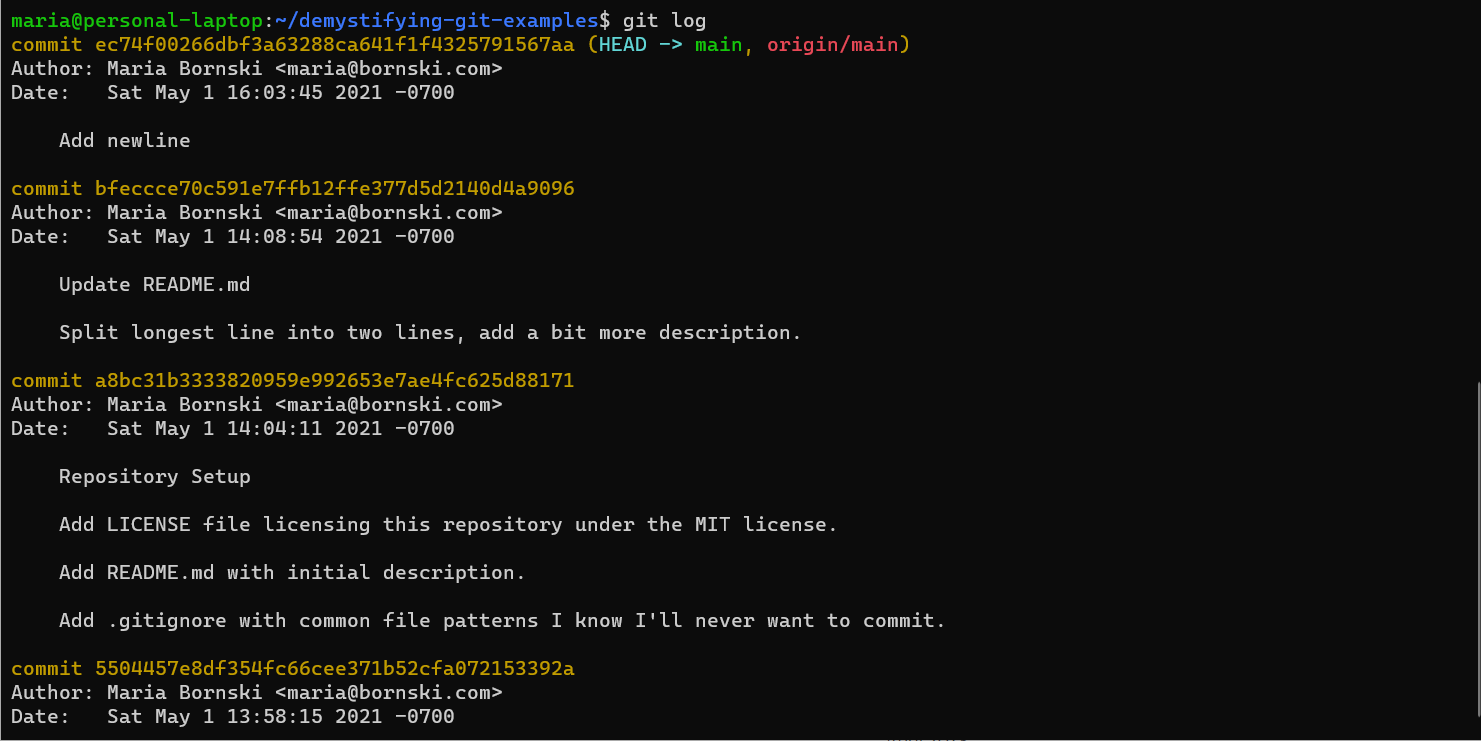
git log is the command you’ll use most frequently to view lists of git commits.
We can use git log to view slightly different information about the same history. The default git log output shows CommitIDs, Author, AuthorDate, and commit messages.
git log“If we want to see just commit IDs and the first line of each commit message, we can use git log --pretty=oneline

git log --pretty=oneline“I frequently want to see both Author and Committer information, plus what actually changed in the commit, so I use git log -p --pretty=fuller frequently:
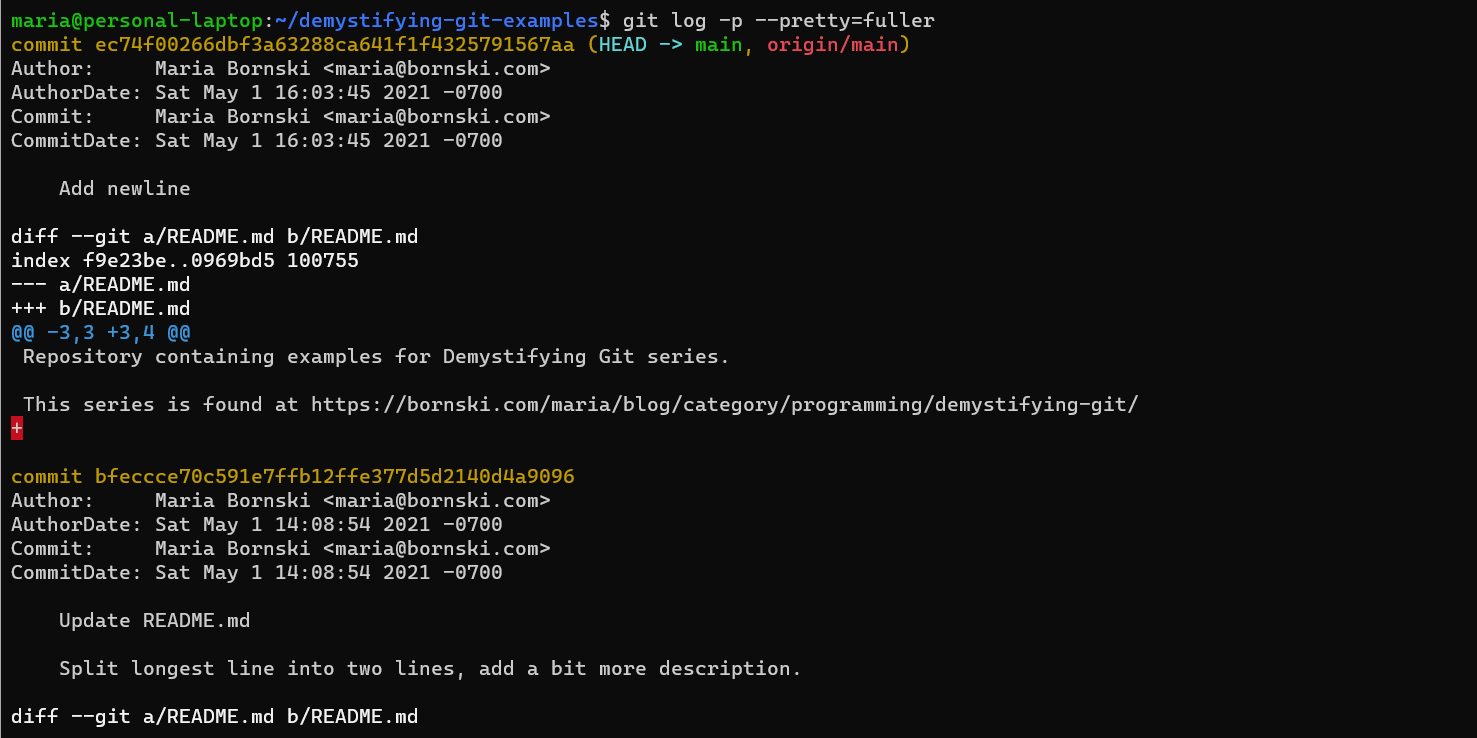
git log -p --pretty=oneline“If you’d like to learn more about ways of viewing git commits, the “Git Basics – Viewing the Commit History” chapter of “ProGit” has a good introduction to the git log command, as do many other online tutorials.
Viewing the git history graph
git log
You can use git log to view the git history graph! By adding --all and --graph to our previous git log --pretty=oneline command, we can see a representation of the history graph for our entire repository:
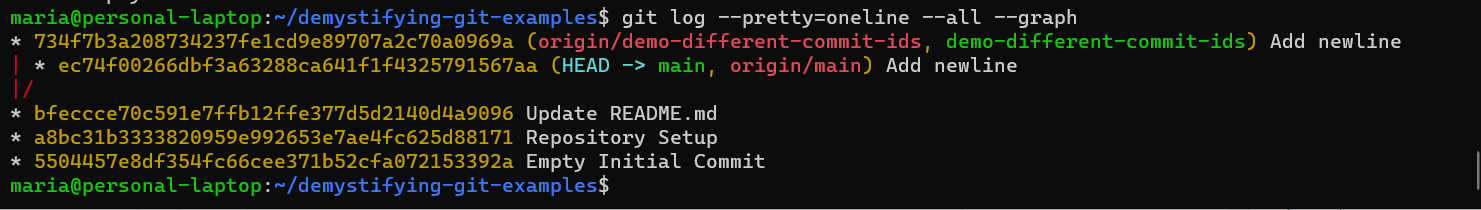
Command:
git log --pretty=oneline --all --graphThis view may get hard to follow as our repository gets bigger, but it’s a useful option if you don’t have any other tools for viewing the history graph. You can include --graph on any git log command, but the longer your output for each commit, the harder the graph will be to follow.
gitk
In the past, I’ve often used gitk for viewing the git history graph. However, I’m writing this post using Windows Subsystem for Linux, so I’m not going to go down the rabbit hole of getting a Linux graphical program to work on WSL.
GitHub
For a site built around git, GitHub sure makes it hard to view the history graph!
After some poking around, it looks like the “Network” view under the “Insights” tab has the right information. Here’s the network view for our demystifying-git-examples repository as it was after Demystifying Git – Git Commits:
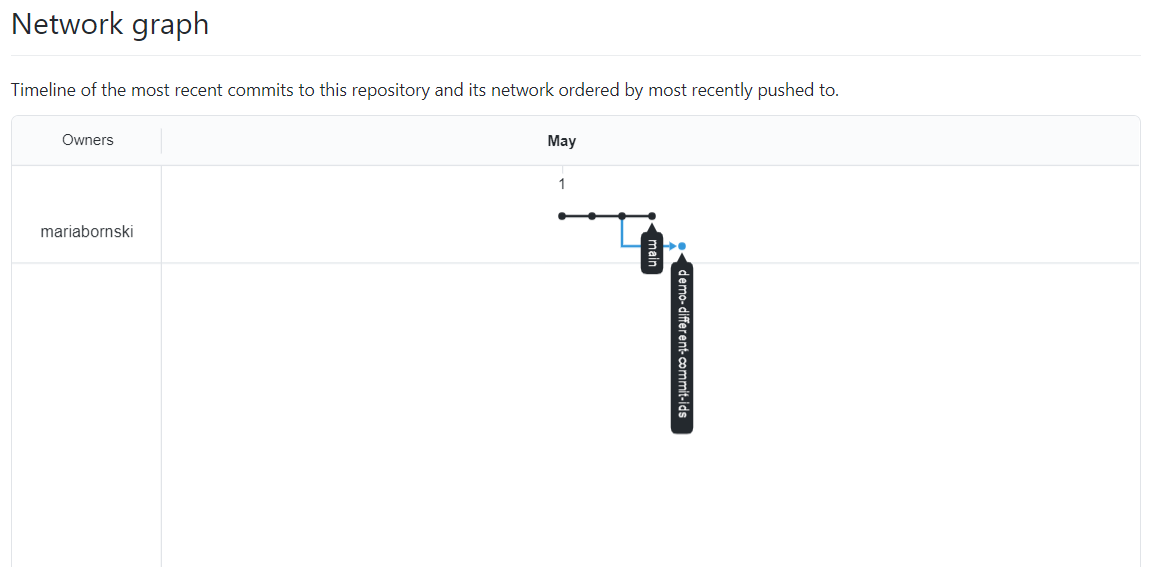
Note that right after Demystifying Git – Git Commits , our history graph is pretty simple — only 2 branches and no merge commits. As we build up this repository with more examples, the history graph will get more complicated
Creating custom git history graphs with graphviz
As I worked on this post, I did not find any “out of the box” solutions that let me show just the git history graph of a repository in an easy to understand way. I did, however, find a git alias example that formats git log output into a format that graphviz can understand. A lot of fighting with sed, awk, and escaping characters later & I’ve added a .gitconfig into demystifying-git-examples that will let me generate graphviz compatible output directly from demystifying-git-examples!
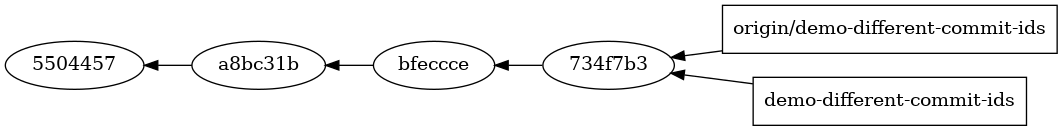
Now that’s a beautiful history graph!!
Unless I make more tweaks, I’ll be using the version of the graphviz git alias from commit 0148822ff of demystifying-git-examples. git won’t automatically pick up the checked in .gitconfig, but you can tell git to use it by running the following from within your local copy of demystifying-git-examples:
git config --local include.path ../.gitconfigNote that this does mean that if you check out a commit within demystifying-git-examples that does not contain this .gitconfig file, or has a different version of it, you’ll get different results from the git aliases. You may, therefore, instead want to copy/paste the git aliases into your global .gitconfig.
Once you’ve pointed git at the aliases that convert history into graphviz format, you can output the graphviz format from your history by running git graphviz <any other options you'd pass to git log> :
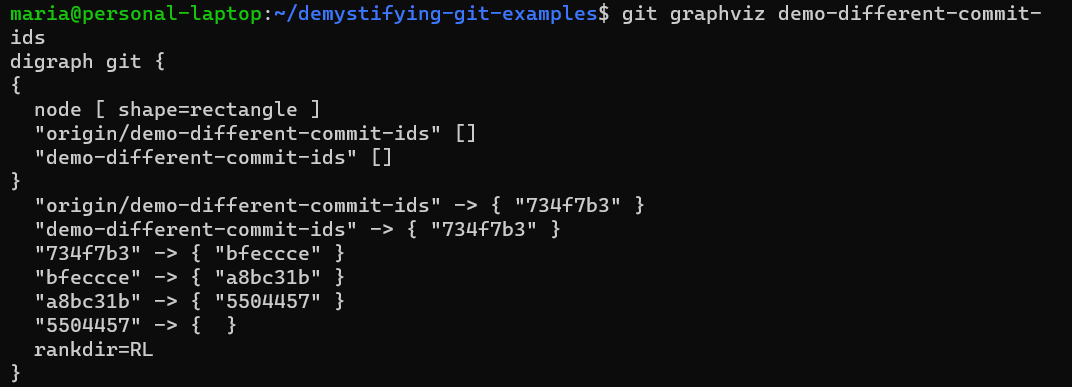
git graphviz demo-different-commit-ids“ I’ve set up the default output to include branch names in the graph, but if you don’t want that, you can use git graphviz-no-branches instead:
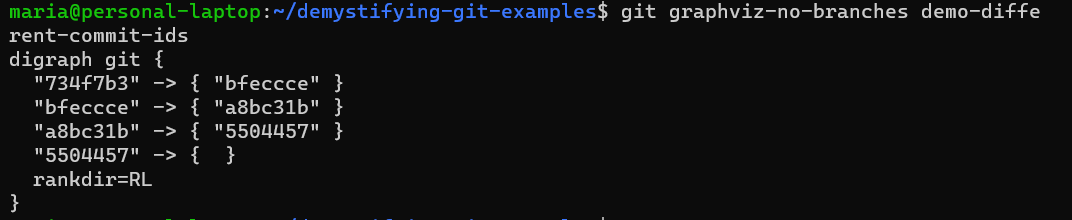
git graphviz-no-branches demo-different-commit-ids “The real magic comes when you covert this to an image. I’m using the dot CLI tool, which I installed as part of graphviz via sudo apt-get install graphviz. By piping our git graphviz output to dot, we can create an image file of our git history:

git graphviz demo-different-commit-ids | dot -Tpng -o demo-different-commit-ids-graph.png “And there we go, our git history graph I showed above:
Coming in Git History, Part 2
I originally intended this to be a single post, but this got long! In Git History, Part 2, we’ll talk about how to navigate the git history graph to figure out what has happened in your repository!
Try it for yourself!
All examples on this post were created using https://github.com/mariabornski/demystifying-git-examples, git version 2.25.1, and dot - graphviz version 2.43.0 (0) on Ubuntu 20.04.1 LTS (GNU/Linux 4.19.128-microsoft-standard x86_64).
You’re welcome to go clone the repository yourself & try out the commands! Similar commands will work on any git repository, you’ll just need to substitute your own commit IDs.